|
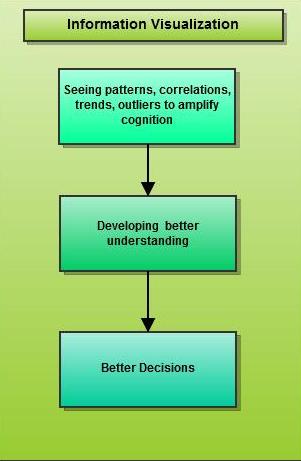
What is Information Visualization?Information visualization is the use of computer supported, interactive, visual representation of abstract data to amplify cognition. Good visual data analysis can lead to better understanding and then to good decisions. This is key to good business intelligence where decisions should be based on evidence rather than intuition. You need to be able to clearly see for example
From the above definition let us expand our undertanding
Limits of StatisticsStatistics can reduce large complex data sets to a few numbers but this can mask subtle interpretations of what is really going on.You also need to be highly trained to safely manipulate statistics but by using simple graphical representations to realise greater understanding. Traditional BI Software FailsBusiness intelligence tools have failed to deliver their promise of intelligence. They fail to recognise that it is humans that understand things and the output of BI tools should be so presented to maximise human understanding. You need to understand the principles of good visual data presentation so that you pick the right BI tool.
|
